Projects
Data Visualizations
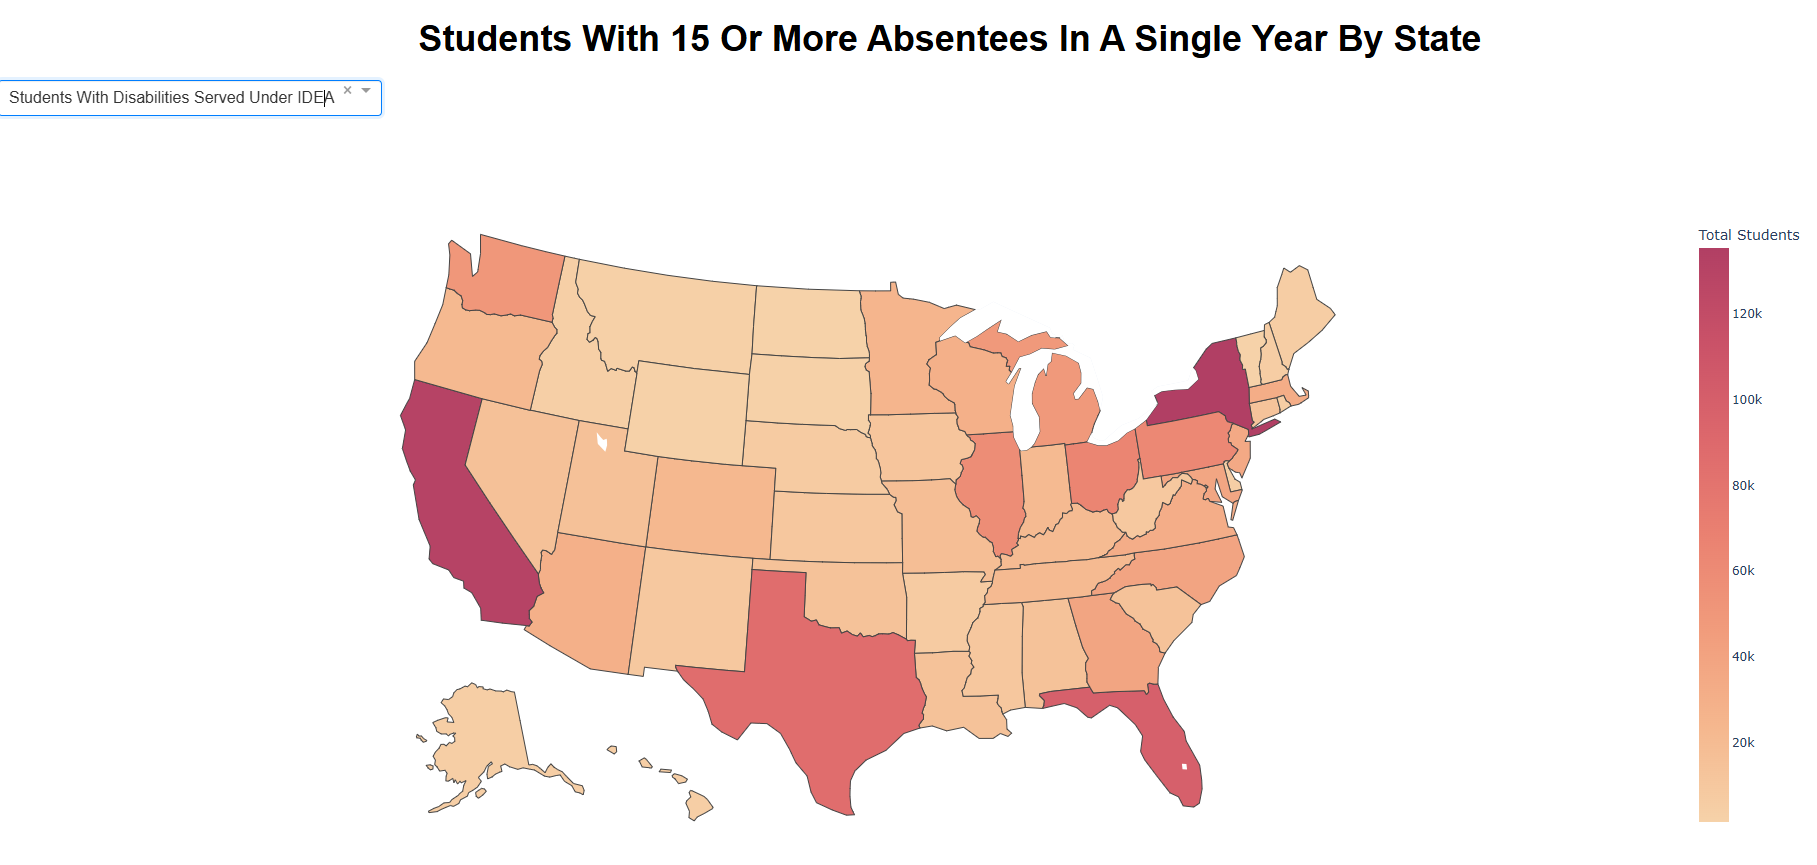
US Student Absenteeism (2015-2016)
Repository Hosted DashboardThis project visualizes student absenteeism data across the United States. The dataset includes information on absentee rates (15+ absences per year) by state, categorized by disability status and race. The data is represented on an interactive map, where users can explore absentee rates across different states and demographics.
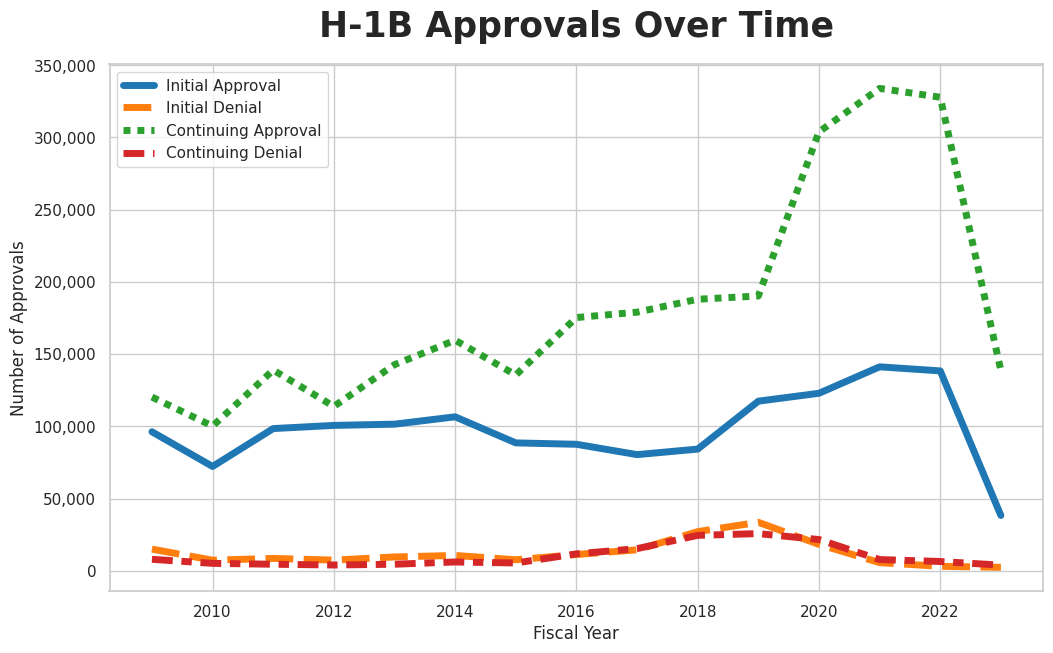
Data Visualization: H-1B Visa Approvals Over Time
RepositoryThis project visualizes the trends in H1B visa approvals in the United States over time using Seaborn. The graph shows how approval rates have changed year by year, offering insights into patterns and fluctuations in the number of H1B visas issued. The dataset used is sourced from publicly available government records, and the analysis is conducted in Python, utilizing Pandas for data manipulation and Seaborn for effective data visualization.
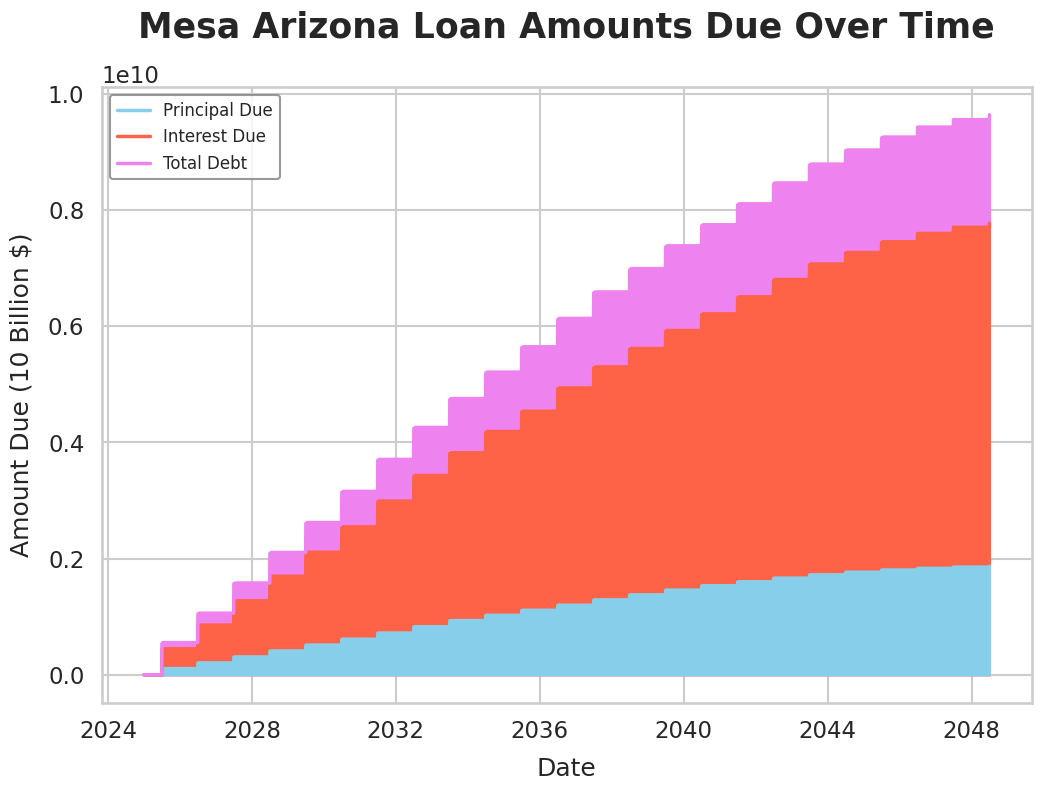
Mesa Arizona Outstanding Loans
RepositoryThis project visualizes the outstanding loan amounts for the city of Mesa, Arizona, using Seaborn. The dataset is analyzed to highlight trends, distributions, and insights into loan patterns. The project demonstrates the use of Seaborn for creating informative and aesthetically pleasing plots to better understand financial data at the city level.
NBA Coaching
RepositoryThis project explores the relationship between shot efficiency and quality in the NBA, with a focus on using shot proximity as a key factor for coaching strategies. By analyzing player shot data, I evaluated how shot location, type, and context affect overall shooting performance. The findings aim to provide insights for coaches on optimizing shot selection, improving team strategies, and enhancing player development based on shot quality metrics.